Theila UI for Talos
Once you have a Talos cluster running, you may find it easier to get insights on your cluster(s) using a visual user interface rather than the talosctl CLI.
For this, Sidero Labs provides Theila, a simple, single-binary web-based visual user interface for Talos clusters.
Prerequisites
You should have a Talos cluster up & running, and the talosconfig file for Theila to access it.
Installation
Theila is published as a single static binary compiled for various platforms and architectures, as well as a container image.
Binary
You can download the correct binary for your system from the releases page, or use the following commands in your terminal.
curl -Lo /usr/local/bin/theila https://github.com/siderolabs/theila/releases/download/v0.2.1/theila-$(uname -s | tr "[:upper:]" "[:lower:]")-amd64
chmod +x /usr/local/bin/theila
Use
Once installed, you can run Theila by simply running it.
# address and port are not required and default to the values shown
theila --address 127.0.0.1 --port 8080
docker run --rm --volume ${HOME}/.talos/config:/opt/talosconfig:ro --env TALOSCONFIG=/opt/talosconfig --publish 8080:8080 ghcr.io/siderolabs/theila --address 0.0.0.0Once it is running you should be able to point a browser at http://localhost:8080 to open the Theila UI.
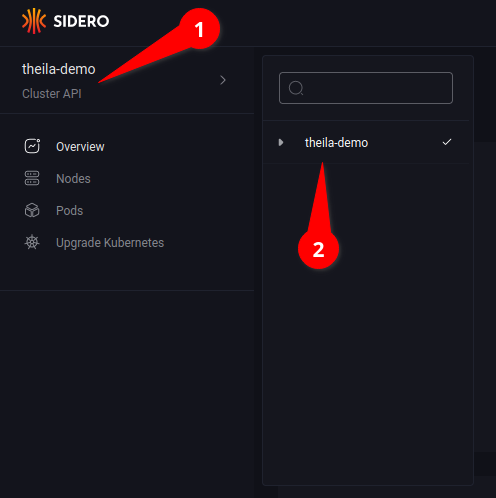
Clusters
You can navigate around various Talos clusters using the menu at the upper-left corner (see 1.1), then selecting the specific cluster from the list (see 1.2).
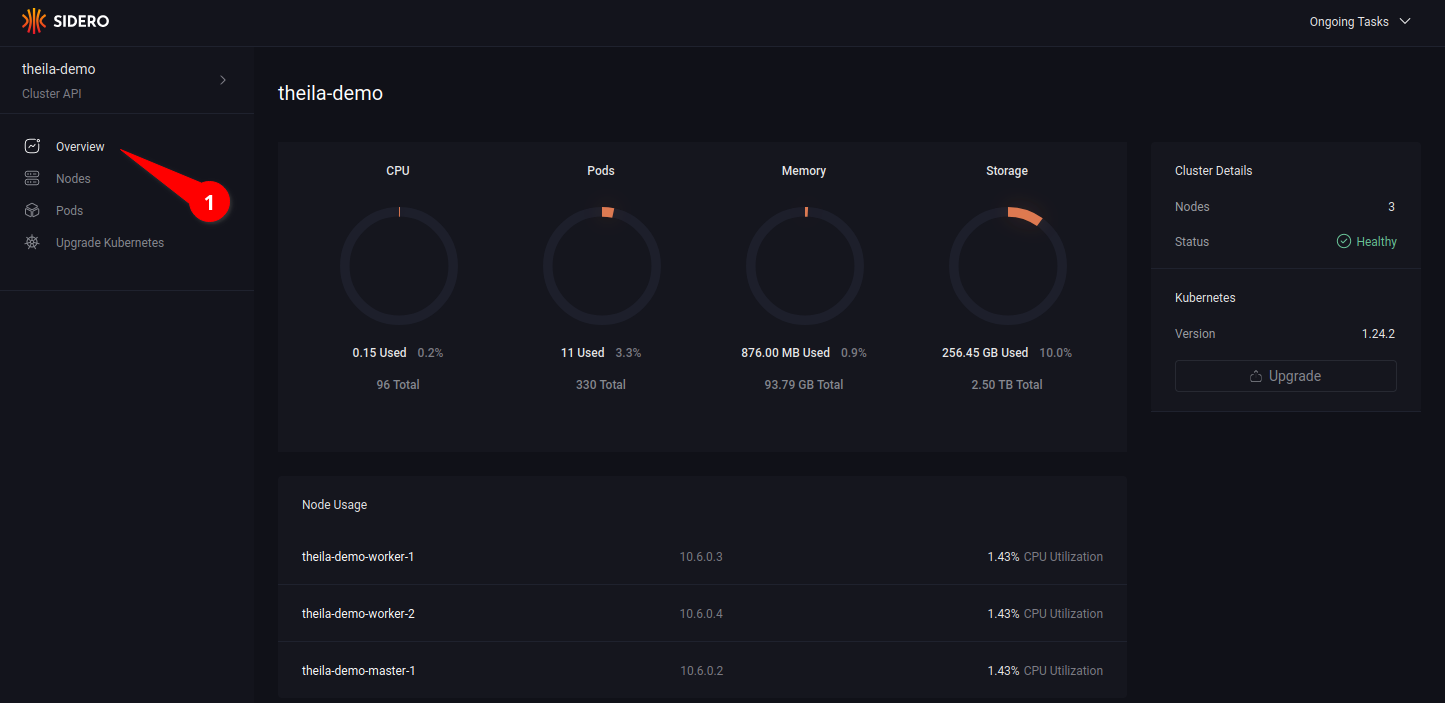
Cluster Overview
Clicking on the “Overview” option in the menu (see 2.1) will display an overview of resource use & health of the cluster.
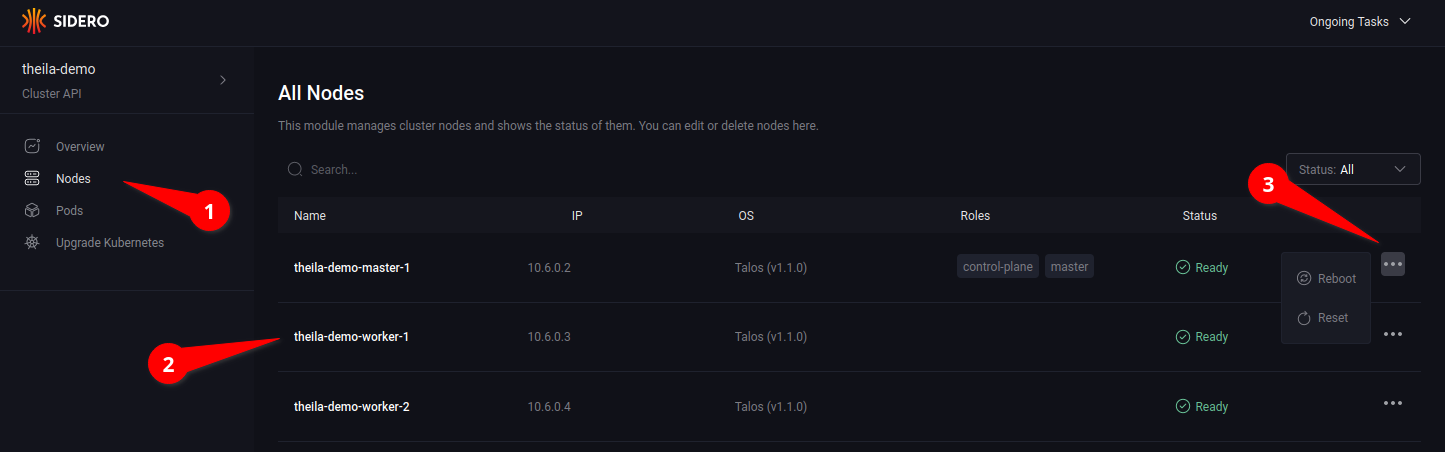
Nodes
Entering the “Nodes” section on the menu (see 3.1) will give a list of nodes in the cluster (see 3.2), along with information such as IP address, status, and any roles assigned to the node.
Opening the node menu (see 3.3) show the actions that can be taken on a specific node.
Clicking on a specific node name in the node list will open the node detail page for more information on each specific node (see 4.1), including running services and their logs (see 4.2).
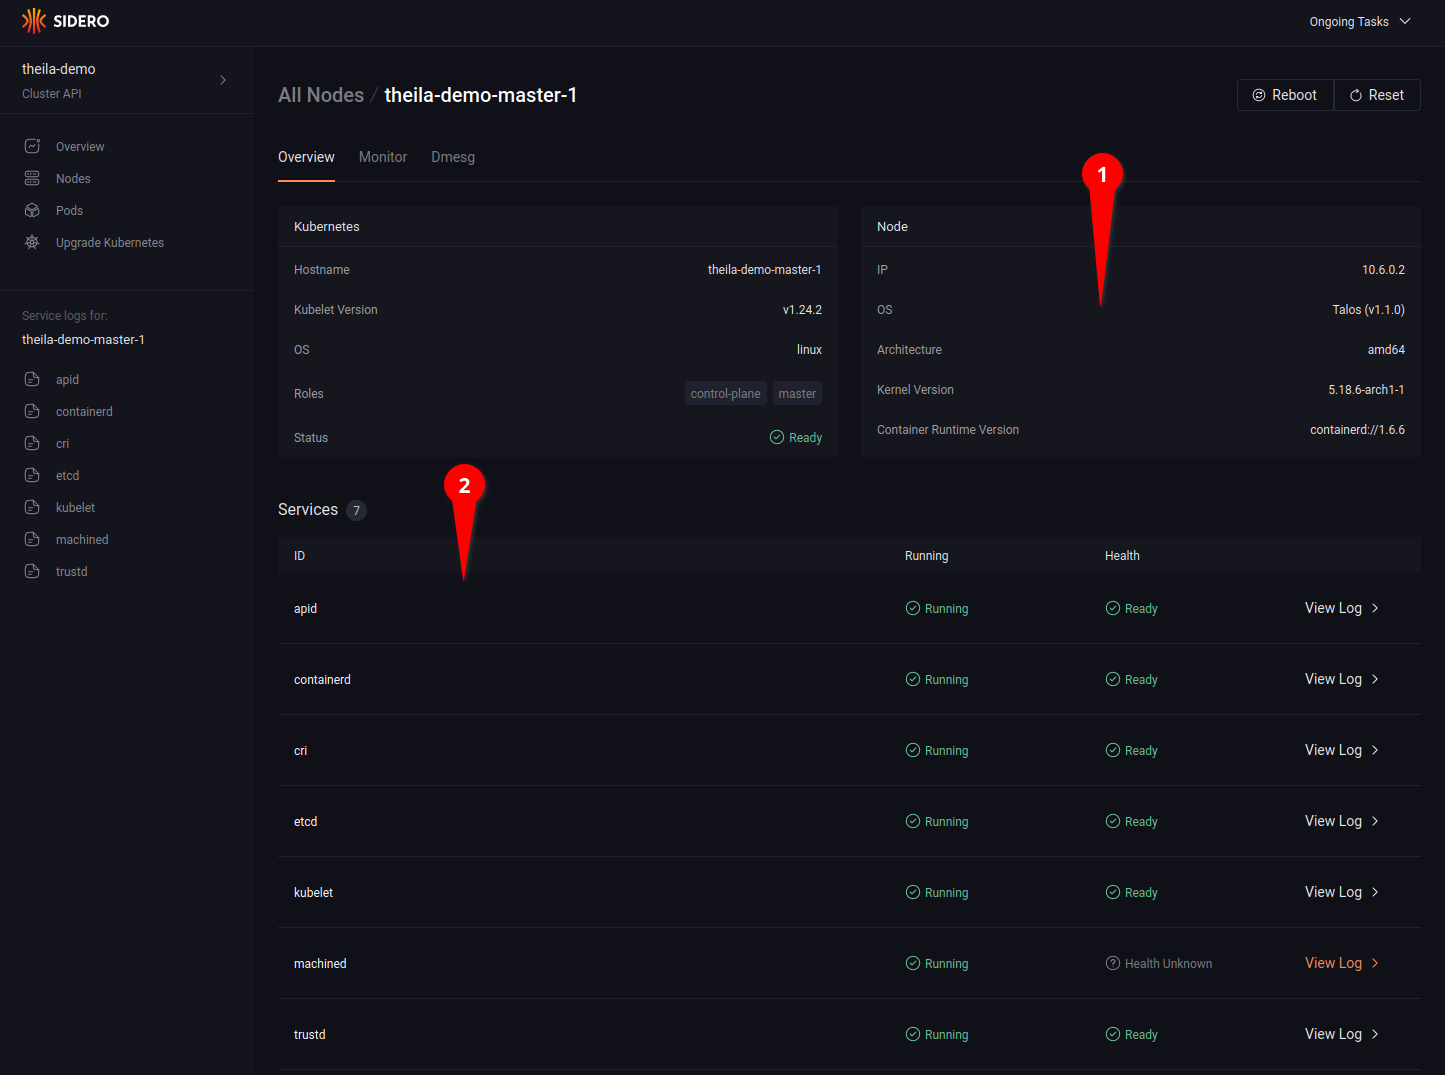
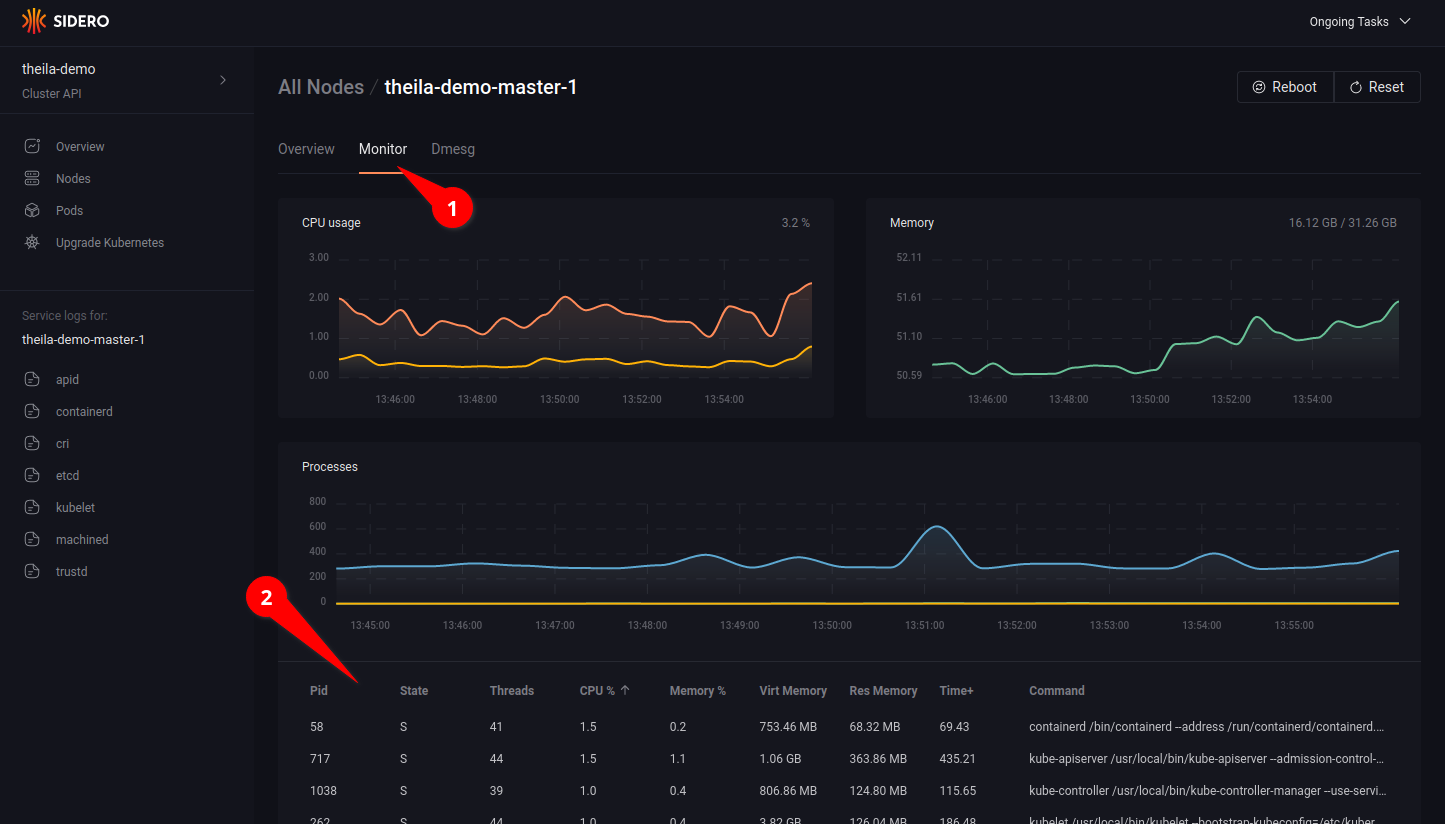
Clicking on the “Monitor” tab (see 5.1) allows you to watch resource use over time, with CPU and memory consumption graphs updated in real time, and a detailed list of running process each with their individual resource use (see 5.2).
Lastly, the “Dmesg” tab shows all kernel messages of the node since boot.
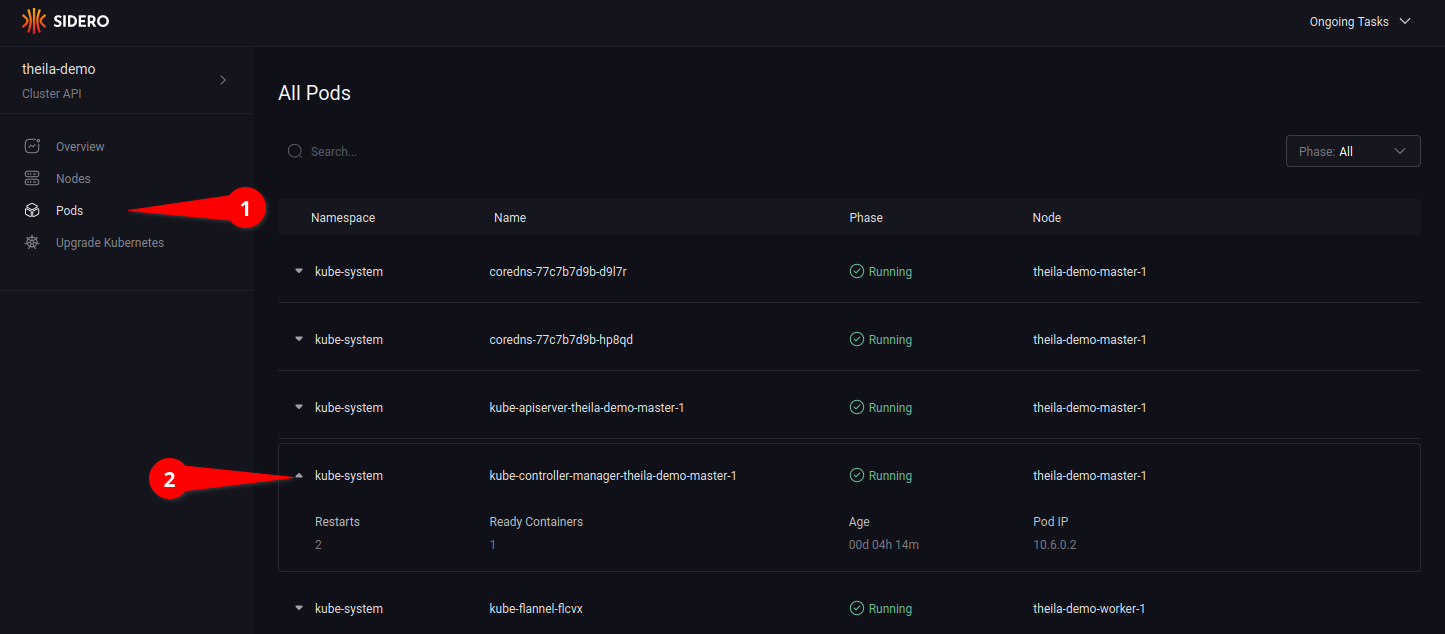
Pods
Using the “Pods” section on the menu (see 6.1) will list all pods in the cluster, across all namespaces.
Clicking on the drop-down arrow (see 6.2) will open up more detailed information of the specified pod.