Interactive Dashboard
Interactive dashboard is enabled for all Talos platforms except for SBC images.
The dashboard can be disabled with kernel parameter talos.dashboard.disabled=1.
The dashboard runs only on the physical video console (not serial console) on the 2nd virtual TTY.
The first virtual TTY shows kernel logs same as in Talos <1.4.0.
The virtual TTYs can be switched with <Alt+F1> and <Alt+F2> keys.
Keys <F1> - <Fn> can be used to switch between different screens of the dashboard.
The dashboard is using either UEFI framebuffer or VGA/VESA framebuffer (for legacy BIOS boot).
For legacy BIOS boot screen resolution can be controlled with the vga= kernel parameter.
Summary Screen (F1)
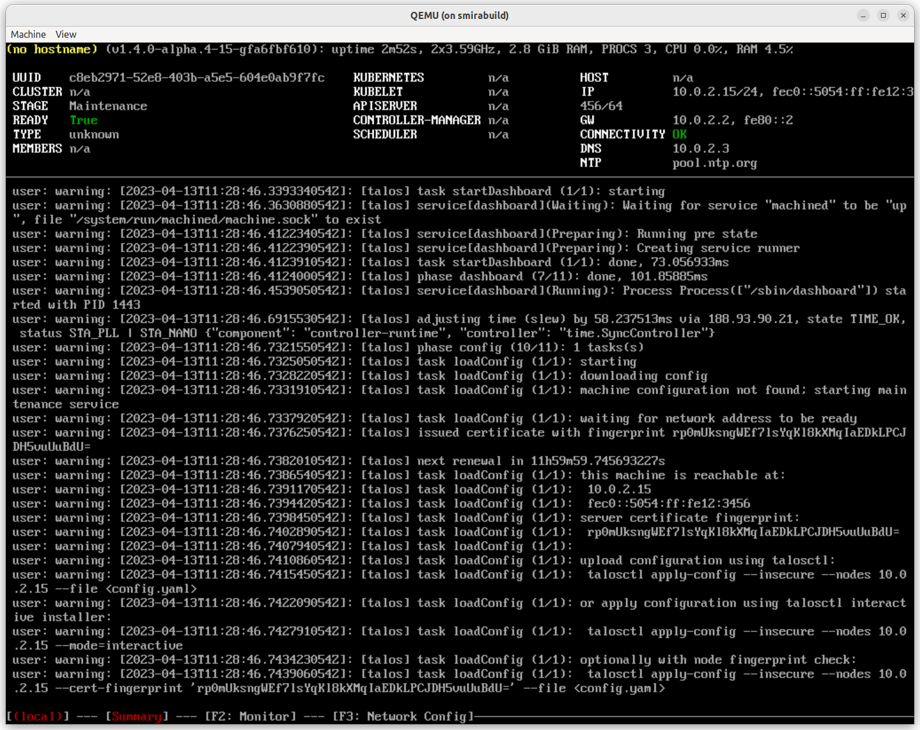
Interactive Dashboard Summary Screen
The header shows brief information about the node:
- hostname
- Talos version
- uptime
- CPU and memory hardware information
- CPU and memory load, number of processes
Table view presents summary information about the machine:
- UUID (from SMBIOS data)
- Cluster name (when the machine config is available)
- Machine stage:
Installing,Upgrading,Booting,Maintenance,Running,Rebooting,Shutting down, etc. - Machine stage readiness: checks Talos service status, static pod status, etc. (for
Runningstage) - Machine type: controlplane/worker
- Number of members discovered in the cluster
- Kubernetes version
- Status of Kubernetes components:
kubeletand Kubernetes controlplane components (only oncontrolplanemachines) - Network information: Hostname, Addresses, Gateway, Connectivity, DNS and NTP servers
Bottom part of the screen shows kernel logs, same as on the virtual TTY 1.
Monitor Screen (F2)
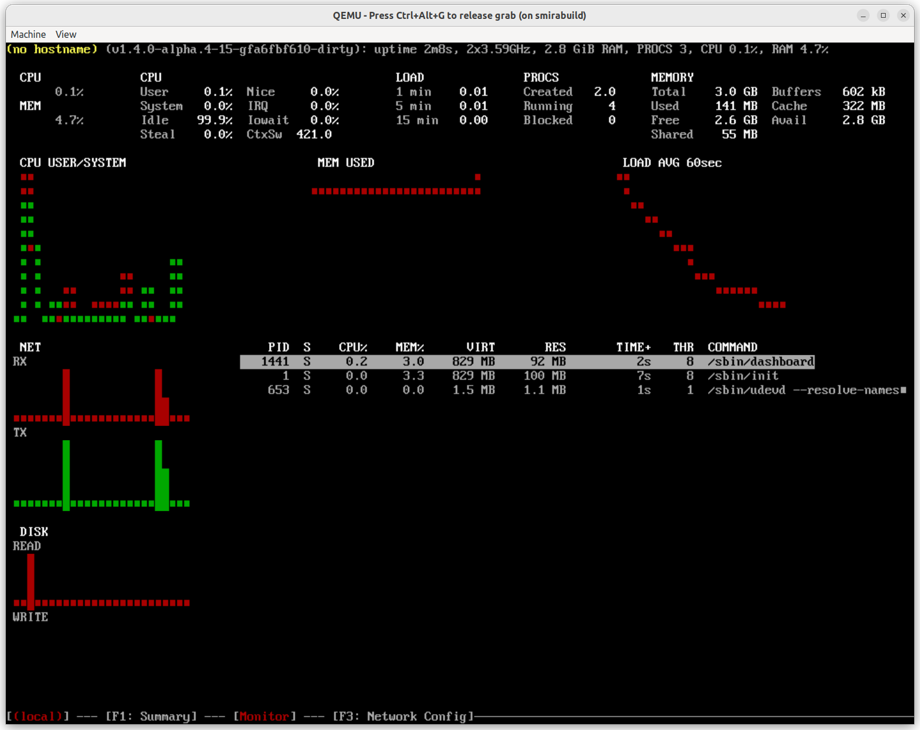
Interactive Dashboard Monitor Screen
Monitor screen provides live view of the machine resource usage: CPU, memory, disk, network and processes.
Network Config Screen (F3)
Note: network config screen is only available for
metalplatform.
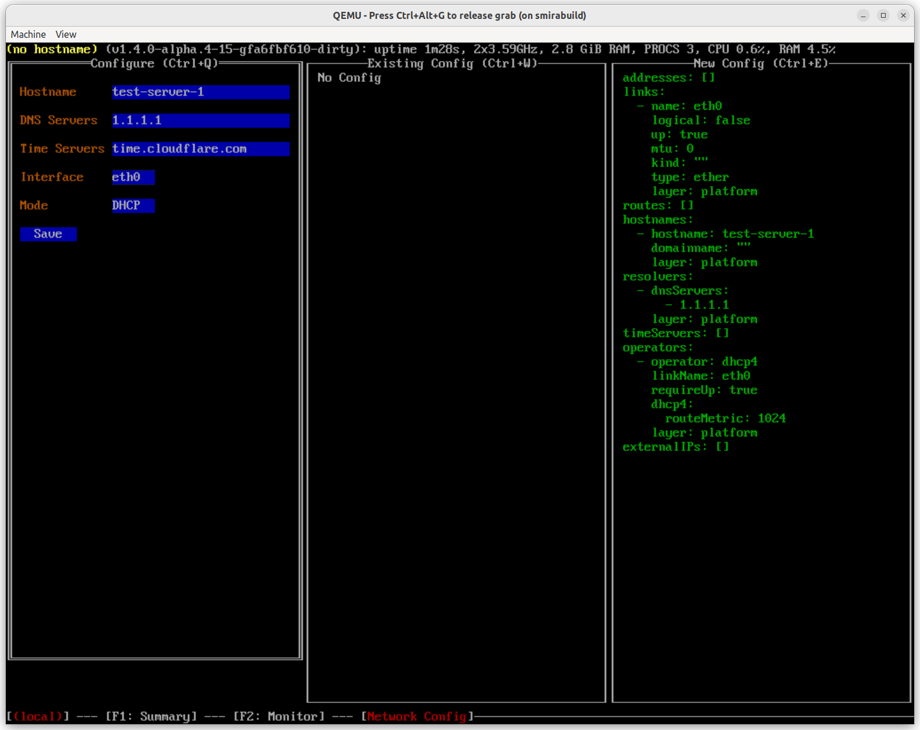
Interactive Dashboard Network Config Screen
Network config screen provides editing capabilities for the metal platform network configuration.
The screen is split into three sections:
- the leftmost section provides a way to enter network configuration: hostname, DNS and NTP servers, configure the network interface either via DHCP or static IP address, etc.
- the middle section shows the current network configuration.
- the rightmost section shows the network configuration which will be applied after pressing “Save” button.
Once the platform network configuration is saved, it is immediately applied to the machine.